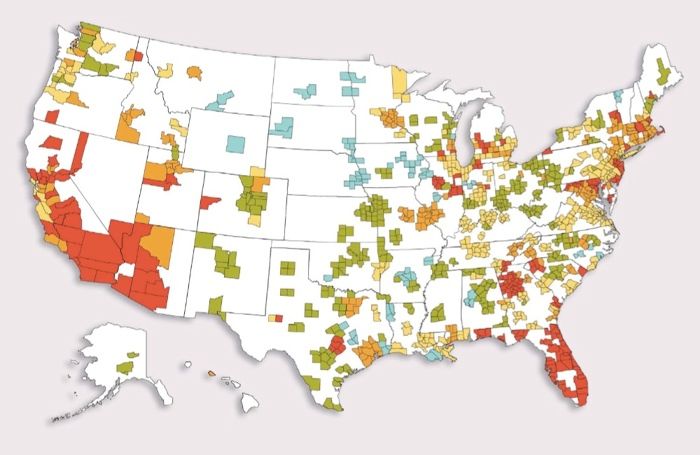
It’s little surprise that the housing markets least inflated during the housing bubble also saw relatively modest price declines, in most cases, during the bust. The question for homebuyers – and, to an extent, homebuilders – is whether the nation’s historically sleepy markets can, by virtue of their relative market stability, attract a bit more sales activity than usual.
A feature published recently by SmartMoney.com profiled five low-risk housing markets using mortgage-insurance and research firm PMI Group Inc.’s PMI Risk Index. The index is based on analytics specialist CoreLogic’s repeat-transaction home price index and on PMI’s own analysis of market factors (including housing supply and employment, mortgage, and foreclosure rates) in 366 metropolitan statistical areas (MSAs) and 29 metropolitan divisions nationwide. The aim of the Risk Index is to gauge the likelihood of lower home prices over the next two years.
Among the nation’s 50 largest markets, for example, the PMI Risk Index published last May showed the Fort Lauderdale-Pompano Beach-Deerfield Beach MSA with a 100% chance of seeing price declines over the next two years. The state with the lowest risk, North Dakota, came in with a 1.8% chance of a home-price decline over the same period. Nebraska, South Dakota, and Vermont also posted low-risk index rankings, as did many MSAs in the South and Midwest, where prices during the boom climbed less steeply than on the coasts.
In search of market stability
The five markets pegged by SmartMoney.com, the magazine notes, landed price-decline risk ratings of 26% or less, and have unemployment rates below the 9.8% national average. Topping the profile lineup is Omaha, Nebraska, with a price-decline risk of 3.1%, and, in October, an unemployment rate of 4.9%, thanks in part to the area’s growing biofuel industry and an accompanying influx of financial-services and data processing firms.
Next on the list is Pittsburgh, Pennsylvania (12% price-decline risk), whose natural-gas industry has propelled the area’s home prices up 8% over the past five years, despite a decline in 2010. The unemployment rate in October, at 8.2%, is by no means ideal, but likely would be considerably higher without the area’s relatively robust market for health care workers and employees at the University of Pittsburgh and Carnegie Melon University.
The third location profiled, Montgomery, Alabama (13.1% price-decline risk), has both Maxwell Air Force Base and competitively paying jobs at a local Hyundai Motor America plant to help sustain demand for homes in the city. Madison, Wisconsin (20.7% price-decline risk), anchored economically by the University of Wisconsin and also home to the state capitol and the Oscar Mayer cold-cut production company, landed in SmartMoney.com’s fourth-place profile. For the first three quarters of 2010, the median price of homes selling in Shorewood Hills, a suburb on the west side of Madison where million-dollar listings are fairly common, topped $500,000.
Upscale real estate also seemed to be holding its own during the fall season in and around San Antonio, Texas (25.4% price-decline risk) – particularly near the network of walkways and shops lining the San Antonio River, where buyers have been known to shell out around $900,000 for homes with just over 3,000 sq. ft. The citywide median listing price, however, is $145,600, according to Zillow.com.
Fine Homebuilding Recommended Products
Fine Homebuilding receives a commission for items purchased through links on this site, including Amazon Associates and other affiliate advertising programs.

8067 All-Weather Flashing Tape

Reliable Crimp Connectors

Affordable IR Camera

This map depicts second-quarter 2010 house price risk for 366 metropolitan statistical areas and 29 metro divisions, based on PMI Mortgage Insurance’s Market Risk Index. The index's measure of home values is based on CoreLogic’s repeat-transaction house price index. Each percentage range indicates the chance of seeing lower prices in that market over the next two years. The map legend is as follows: light blue, 0.0% to 10%; green, 10% to 30%; yellow, 30% to 50%; orange, 50% to 70%; red, 70% to 100%.


