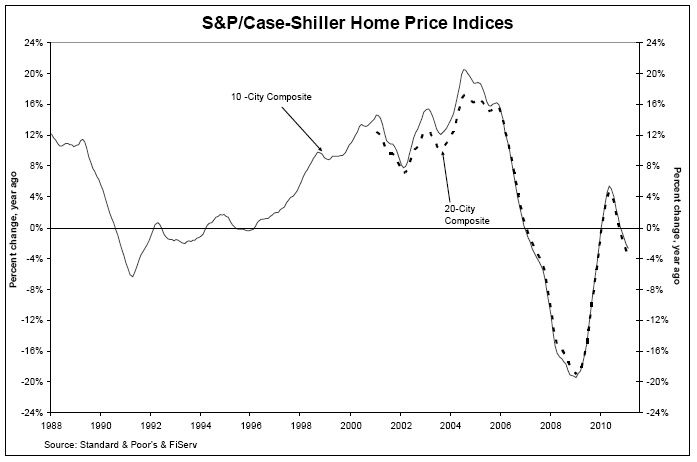
Yes, the S&P/Case-Shiller Home Price index report for February 2011 shows continued price drops nationwide and in most markets comprising the 10- and 20-city composite indices.
For the record, the report, released Tuesday, indicates that prices for both of the city composites were lower in February 2011 than they were in February 2010, but are still (very) slightly above their April 2009 bottom. The 10-city composite, for example, fell 2.6% and the 20-city was down 3.3% from February 2010 levels. Washington, D.C., was the only market among the 20 to post a year-over-year gain, showing an annual growth rate of 2.7%, and Detroit scrabbled to a tiny monthly increase, with a 1.0% gain over January. The 20-city composite index is at 139.27 for February (the low, in April 2009, was 139.26), and the 10-city composite is 1.5% above its low.
So while prices continue to tunnel, the increasingly urgent question becomes: Where is the actual, bedrock bottom? The New York Times Economix blog echoed the question in its summary of the Case-Shiller report on Tuesday, although many other news outlets stuck with analyst forecasts of further price declines.
Another perspective on the numbers
A blogger for The Economist agreed with those forecasts, but also took a closer look at the data. Noting that while Case-Shiller has been tracking downward, the indexes are calculated each month using a three-month moving average and then are published with a two-month lag.
“The latest figures include data that became available in December, January, and February,” The Economist points out. “The contracts for those sales may have closed a month or two before, so the figures capture a snapshot of the housing market that includes last fall. Conditions have likely improved since then.”
Another point: Fewer cities hit new lows in February than in January, and the monthly rate of decline continued to slow, with, for example, prices in October falling 0.9%, according to the seasonally adjusted 20-city index, but falling only 0.2% in February. “I think prices may continue to slip in coming months; it was a disappointing first quarter, after all,” the Economist blogger writes. “But looking forward, the case for extreme housing pessimism continues to look weak.”
Adding to the mix of mixed signals are Conference Board data showing an uptick in consumer confidence in April (the increase was tempered by rising gas prices) and Monday’s Commerce Department report on new-home sales for March, which showed a monthly gain of 11.1% to a seasonally adjusted annual rate of 300,000 units. The National Association of Home Builders said the sales pace in March more fairly reflects current market conditions, and that the extremely slow pace in January and February was due to unusually severe winter weather.
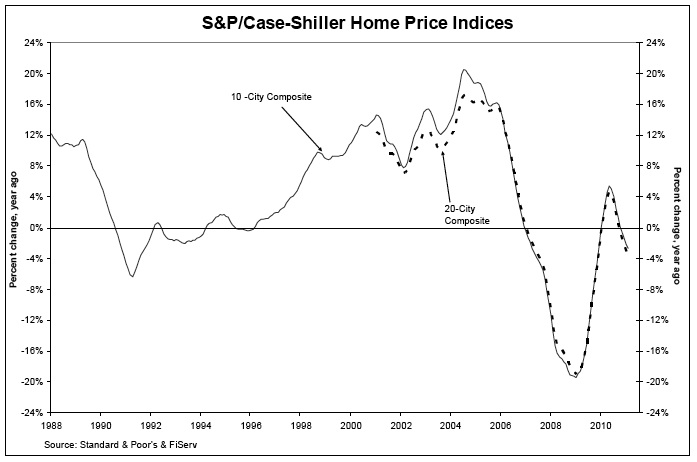
The S&P Case-Shiller Home Price indices for both the 10-city and 20-city composites.

















View Comments
I happened to stumble upon this article in storage for some reason and think that's it's actually rather ironic, considering how big the property bubble is right now, not just in New York but almost everywhere else that investment property can be found. It's not going to be long before the cycle continues though, so just keep an eye out for when things start to tumble down the way of this article soon...