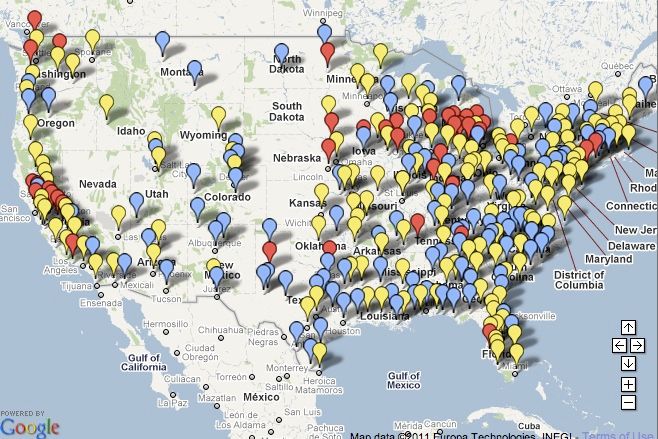
One of the pitches being made by organizers of the Sunbelt Builders Show, scheduled for October 20-22 in Austin, Texas, is that parts of the Sunbelt have been seeing decent homebuilding activity.
Decent, in this case, means single-family permits issued at twice the rate (or more) per 1,000-population than the national average. As noted in a recent analysis posted by Reed Construction Data economist Jim Haughey, Census Bureau figures show that 19 cities fall into that category – five in Texas, six in the Carolinas, and one each in Augusta, Georgia; Baton Rouge, Louisiana; Des Moines, Iowa; Little Rock, Arkansas; Nashville, Tennessee; Omaha; Provo, Utah; and Bradenton-Sarasota, Florida.
Where effects of the recession were milder
These cities share a few characteristics that have helped them weather the housing downturn better than most. All except one – Houston, Texas – are relatively small markets whose economies have relied on a number employment sources other than homebuilding, and whose housing was fairly inexpensive even during the boom – a factor that reduced incentives for subprime lending and helped keep prices from surging. The only city of the 19 that has suffered considerably from recessionary forces is Bradenton-Sarasota, Haughey adds.
“The dominating local trends include countercyclical expansion of local universities, military bases and newly discovered oil and gas fields,” he writes. “Housing permit issuance in most of the large housing markets is well below the housing peak level and continues to ebb lower apart from the brief surge and collapse of permits caused by the homeowner tax credit.”
Fine Homebuilding Recommended Products
Fine Homebuilding receives a commission for items purchased through links on this site, including Amazon Associates and other affiliate advertising programs.

8067 All-Weather Flashing Tape

Affordable IR Camera

Handy Heat Gun

This screen shot shows the Expansion Index from Reed Construction Data, an interactive map showing a 12-to-18-month "look ahead" at the construction marketplace. The blue balloons mark Metropolitan Statistical Areas where construction volume is expected to shrink in the coming 12 months, yellow balloons mark locations where expansion is expected, and red balloons indicate locations where expansion is likely to be even more vigorous. The chart currently represents data from May 2011, and is scheduled to be updated next month. The link to the actual map is here: http://www.reedconstructiondata.com/market-intelligence/expansion-index/


